Lance's Corner

GAO Highlights Increasing Health Insurance Costs

Dec 5, 2024

Per the notice below, the United States Government Accountability Office (GAO) is highlighting the increasing cost of health insurance.

Health Insurance Costs Are Increasing As Markets Become More Concentrated with Fewer Insurance Companies (interactive map)

Health care experts are warning that costs for insurance will likely rise again in 2025.

One trend that may be contributing to higher insurance costs is the growing market concentration among fewer insurance companies.  We recently looked at changes in private health insurance market concentration.  We also compared costs under two types of private health plans—employer-sponsored plans and individual plans offered on the Healthcare.gov Marketplace.  Today’s WatchBlog post looks at what we found and reported in two new reports about these trends.

Stock image showing medication, a stethoscope and $20s --illustrating health care costs.

Private insurance is getting more concentrated, which could raise prices of health coverage

Over the last decade or so, the number of private health insurance companies in each state has decreased.  And in many states, just a few companies may insure most private policy holders.  Concentrated markets are concerning.  As markets become more concentrated, they may also become less competitive.  This may result in higher premiums, decreased access to affordable health insurance, and fewer options for consumers.  We consider a state’s market to be concentrated when three or fewer insurance companies hold at least 80% of the market share of enrollment.  This concentration has been seen in many states for years.  In our November report, we looked to see if concentration trends were true across different private insurance markets—the individual market, and markets for small and large employers.  We found that all three markets have become more concentrated.

States and D.C. Where the 3 Largest Insurance Companies Had At Least 80% of Enrollment, 2011-2022

Bar charts showing changes in health care concentration across individual, small group, and large group markets.

Individual market.  People without employer-sponsored health coverage may get coverage through the individual market, including through the individual exchanges using Healthcare.gov.  In 2022 most people—about 13.5 million—who got their health coverage in the individual market did so through individual exchanges.  When we looked across states, we found that the individual market became more concentrated from 2011 through 2022.  At its peak in 2019, 47 states were concentrated.  However, since then, enrollment has become less concentrated with the number decreasing to 35 states in 2022.

Small-employer group market.  Over 11 million people enrolled in insurance plans in 2022 through small-employer group health insurance.  This market also became more concentrated from 2011 through 2022—with 47 states having concentrated markets in 2022.  The rate of concentration has slowed more recently.

Large-employer group market.  The large-employer group market is also the largest of three market types with more than 40 million people enrolled in insurance plans in 2022.  Over the years, this market has remained concentrated with only slight increases from 40 states in 2011 to 43 states in 2022.

Why are markets so concentrated?  Increased market concentration has often been the result of consolidation—mergers and acquisitions—among existing insurance companies.  However, concentration can also increase if existing health insurance companies leave the market, reducing the number of issuers from which consumers can purchase coverage.  And high concentration can make it difficult for new issuers to enter a market.  Perpetuating the issue.

Our interactive map allows a look into how states’ market concentration compare.  Click on the graphic below (and linked here) to check it out.
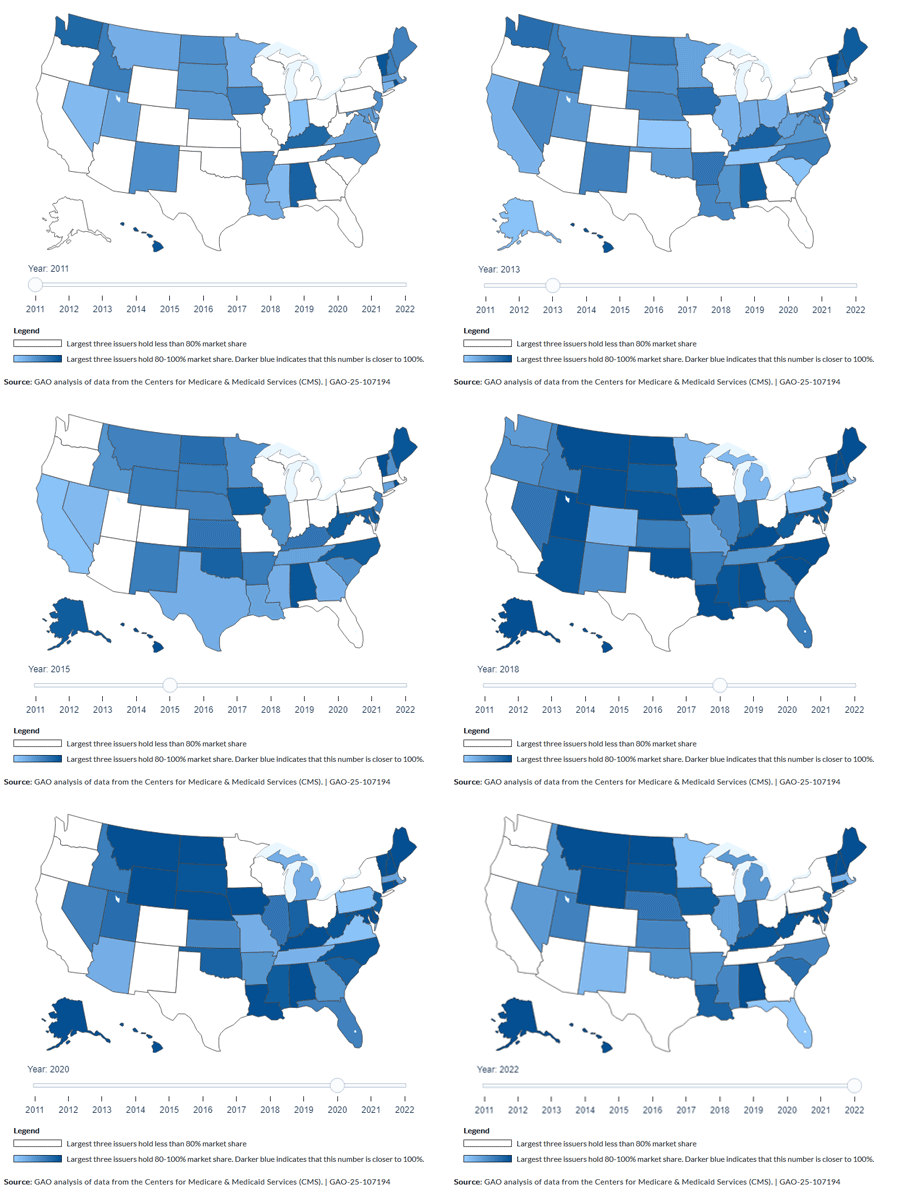
GIF showing how the interactive graphic (a map) on health care market concertation works.  

How do costs under employer-sponsored plans compare to those on Healthcare.gov?

Private health coverage is the most common source of health coverage in the United States.  And according to national estimates, spending on private health coverage may exceed $1.5 trillion this year.  These costs are growing and can have a significant impact on Americans.  About 165 million Americans get their health coverage through employer-sponsored plans.  Under these plans, an employer and employees typically share the cost to purchase coverage—referred to as the premium.  Those who don’t have employer-sponsored plans can get coverage through the individual market, such as Healthcare.gov Marketplaces plans.  As previously stated, in 2022, 13.5 million people signed up for Marketplace plans—under which the federal government and the policy holder typically share the cost of the premium.  In a new report, we compared premiums under employer-sponsored plans with gold, silver, and bronze tier individual plans purchased on the Marketplace.  We found that employer-sponsored plans had, on average, lower estimated premiums per person covered than Marketplace plans.  But employer-sponsored plans also required higher estimated contributions from those covered.  Specifically, when we looked across 33 states that were included in our review, we found:

  • Monthly per person premiums were on average $54 lower under employer-sponsored plans

  • Monthly per person contributions were on average $41 higher for employer-sponsored plans.

Comparison of Per Person Premiums and Enrollee Contributions across 33 states, 2022

Bar chart comparing Marketplace premiums and contributions to employer-sponsored plans. Employee contributions were higher under employer-sponsored plans. But the overall policy cost was less.

This comparison is complicated by differences between employer-sponsored and Marketplace plans—including in covered populations, plan designs, and tax treatment.  We outline more of the differences between these two types of private health plans in our full report from November.  You can also learn more about our work on health care costs by checking out our special issues page about federal health care spending.

USDOL Issues Comprehensive Employer Guidance on Long COVID

The United States Department of Labor (USDOL) has issued a comprehensive set of resources that can be accessed below for employers on dealing with Long COVID.

Supporting Employees with Long COVID: A Guide for Employers

The “Supporting Employees with Long COVID” guide from the USDOL-funded Employer Assistance and Resource Network on Disability Inclusion (EARN) and Job Accommodation Network (JAN) addresses the basics of Long COVID, including its intersection with mental health, and common workplace supports for different symptoms.  It also explores employers’ responsibilities to provide reasonable accommodations and answers frequently asked questions about Long COVID and employment, including inquiries related to telework and leave.

Download the guide

Accommodation and Compliance: Long COVID

The Long COVID Accommodation and Compliance webpage from the USDOL-funded Job Accommodation Network (JAN) helps employers and employees understand strategies for supporting workers with Long COVID.  Topics include Long COVID in the context of disability under the Americans with Disabilities Act (ADA), specific accommodation ideas based on limitations or work-related functions, common situations and solutions, and questions to consider when identifying effective accommodations for employees with Long COVID.  Find this and other Long COVID resources from JAN, below:

Long COVID, Disability and Underserved Communities: Recommendations for Employers

The research-to-practice brief “Long COVID, Disability and Underserved Communities” synthesizes an extensive review of documents, literature and data sources, conducted by the USDOL-funded Employer Assistance and Resource Network on Disability Inclusion (EARN) on the impact of Long COVID on employment, with a focus on demographic differences.  It also outlines recommended actions organizations can take to create a supportive and inclusive workplace culture for people with Long COVID, especially those with disabilities who belong to other historically underserved groups.

Read the brief

Long COVID and Disability Accommodations in the Workplace

The policy brief “Long COVID and Disability Accommodations in the Workplace” explores Long COVID’s impact on the workforce and provides examples of policy actions different states are taking to help affected people remain at work or return when ready.  It was developed by the National Conference of State Legislatures (NCSL) as part of its involvement in USDOL’s State Exchange on Employment and Disability (SEED) initiative.

Download the policy brief

Understanding and Addressing the Workplace Challenges Related to Long COVID

The report “Understanding and Addressing the Workplace Challenges Related to Long COVID” summarizes key themes and takeaways from an ePolicyWorks national online dialogue through which members of the public were invited to share their experiences and insights regarding workplace challenges posed by Long COVID.  The dialogue took place during summer 2022 and was hosted by USDOL and its agencies in collaboration with the Centers for Disease Control and Prevention and the U.S. Surgeon General.

Download the report

Working with Long COVID

The USDOL-published “Working with Long COVID” fact sheet shares strategies for supporting workers with Long COVID, including accommodations for common symptoms and resources for further guidance and assistance with specific situations.

Download the fact sheet

COVID-19: Long-Term Symptoms

This USDOL motion graphic informs workers with Long COVID that they may be entitled to temporary or long-term supports to help them stay on the job or return to work when ready, and shares where they can find related assistance.

Watch the motion graphic

A Personal Story of Long COVID and Disability Disclosure

In the podcast “A Personal Story of Long COVID and Disability Disclosure,” Pam Bingham, senior program manager for Intuit’s Diversity, Equity and Inclusion in Tech team, shares her personal experience of navigating Long COVID symptoms at work.  The segment was produced by the USDOL-funded Partnership on Employment and Accessible Technology (PEAT) as part of its ongoing “Future of Work” podcast series.

Listen to the podcast

HHS OIG Issues Annual Report on State MFCUs

Per the notice below, the Office of the Inspector General (OIG) of the United States Department of Health and Human Services (HHS) has issued its annual report on the performance of state Medicaid Fraud Control Units (MFCUs).

Medicaid Fraud Control Units Fiscal Year 2023 Annual Report (OEI-09-24-00200) 

Medicaid Fraud Control Units (MFCUs) investigate and prosecute Medicaid provider fraud and patient abuse or neglect. OIG is the Federal agency that oversees and annually approves federal funding for MFCUs through a recertification process. This new report analyzed the statistical data on annual case outcomes—such as convictions, civil settlements and judgments, and recoveries—that the 53 MFCUs submitted for Fiscal Year 2023.  New York data is as follows:

Outcomes

  • Investigations1 - 556
  • Indicted/Charged - 9
  • Convictions - 8
  • Civil Settlements/Judgments - 28
  • Recoveries2 - $73,204,518

Resources

  • MFCU Expenditures3 - $55,964,293
  • Staff on Board4 - 257

1Investigations are defined as the total number of open investigations at the end of the fiscal year.

2Recoveries are defined as the amount of money that defendants are required to pay as a result of a settlement, judgment, or prefiling settlement in criminal and civil cases and may not reflect actual collections.  Recoveries may involve cases that include participation by other Federal and State agencies.

3MFCU and Medicaid Expenditures include both State and Federal expenditures.

4Staff on Board is defined as the total number of staff employed by the Unit at the end of the fiscal year.

Read the Full Report

View the Statistical Chart

Engage with the Interactive Map

GAO Issues Report on Medicaid Managed Care Service Denials and Appeal Outcomes

The United States Government Accountability Office (GAO) has issued a report on federal use of state data on Medicaid managed care service denials and appeal outcomes.  GAO found that federal oversight is limited because it doesn't require states to report on Medicaid managed care service denials or appeal outcomes and there has not been much progress on plans to analyze and make the data publicly available.  To read the GAO report on federal use of state data on Medicaid managed care service denials and appeal outcomes, use the first link below.  To read GAO highlights of the report on federal use of state data on Medicaid managed care service denials and appeal outcomes, use the second link below.
https://www.gao.gov/assets/d24106627.pdf  (GAO report on federal use of state data on Medicaid managed care service denials and appeal outcomes)
https://www.gao.gov/assets/d24106627_high.pdf  (GAO highlights on federal use of state data on Medicaid managed care service denials and appeal outcomes)

CMS Issues Latest Medicare Regulatory Activities Update

The Centers for Medicare and Medicaid Services (CMS) has issued its latest update on its regulatory activities in the Medicare program.  While dentistry is only minimally connected to the Medicare program, Medicare drives the majority of health care policies and insurance reimbursement policies throughout the country.  Therefore, it always pays to keep a close eye on what CMS is doing in Medicare.  To read the latest CMS update on its regulatory activities in Medicare, use the link below.
https://www.cms.gov/training-education/medicare-learning-network/newsletter/2024-03-14-mlnc